Verify the bug
First of all, let’s verify that the application does indeed crash when opening a malformatted m3u file. (or find yourself an application that crashes when you feed specifically crafted data to it).
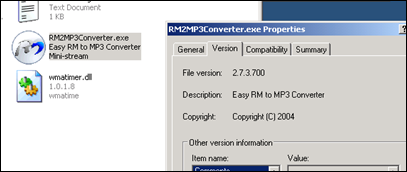
Get yourself a copy of the vulnerable version of Easy RM to MP3 and install it on a computer running Windows XP. The vulnerability report states that the exploit works on XP SP2 (English), but I’ll use XP SP3 (English).
You can find a copy of the vulnerable application on exploit-db
Quick sidenote : you can find older versions of applications at oldapps.com and oldversion.com, or by looking at exploits on exploit-db.com (which often have a local copy of the vulnerable application as well)
We’ll use the following simple perl script to create a .m3u file that may help us to discover more information about the vulnerability :
my $file= "crash.m3u";
my $junk= "\x41" x 10000;
open($FILE,">$file");
print $FILE "$junk";
close($FILE);
print "m3u File Created successfully\n";
Run the perl script to create the m3u file. The fill will be filled with 10000 A’s (\x41 is the hexadecimal representation of A) and open this m3u file with Easy RM to MP3…. The application throws an error, but it looks like the error is handled correctly and the application does not crash. Modify the script to write a file with 20000 A’s and try again. Same behaviour. (exception is handled correctly, so we still could not overwrite anything usefull). Now change the script to write 30000 A’s, create the m3u file and open it in the utility.
Boom – application dies.
Ok, so the application crashes if we feed it a file that contains between 20000 and 30000 A’s. But what can we do with this ?
Verify the bug – and see if it could be interesting
Obviously, not every application crash can lead to an exploitation. In many cases, an application crash will not lead to exploitation… But sometimes it does. With “exploitation”, I mean that you want the application to do something it was not intended to do… such as running your own code. The easiest way to make an application do something different is by controlling its application flow (and redirect it to somewhere else). This can be done by controlling the Instruction Pointer (or Program Counter), which is a CPU register that contains a pointer to where the next instruction that needs to be executed is located.
Suppose an application calls a function with a parameter. Before going to the function, it saves the current location in the instruction pointer (so it knows where to return when the function completes). If you can modify the value in this pointer, and point it to a location in memory that contains your own piece of code, then you can change the application flow and make it execute something different (other than returning back to the original place). The code that you want to be executed after controlling the flow is often referred to as “shellcode”. So if we make the application run our shellcode, we can call it a working exploit. In most cases, this pointer is referenced by the term EIP. This register size is 4 bytes. So if you can modify those 4 bytes, you own the application (and the computer the application runs on)
Before we proceed – some theory
Just a few terms that you will need :
Every Windows application uses parts of memory. The process memory contains 3 major components :
code segment (instructions that the processor executes. The EIP keeps track of the next instruction)
data segment (variables, dynamic buffers)
stack segment (used to pass data/arguments to functions, and is used as space for variables. The stack starts (= the bottom of the stack) from the very end of the virtual memory of a page and grows down (to a lower address). a PUSH adds something to the top of the stack, POP will remove one item (4 bytes) from the stack and puts it in a register.
If you want to access the stack memory directly, you can use ESP (Stack Pointer), which points at the top (so the lowest memory address) of the stack.
After a push, ESP will point to a lower memory address (address is decremented with the size of the data that is pushed onto the stack, which is 4 bytes in case of addresses/pointers). Decrements usually happen before the item is placed on the stack (depending on the implementation… if ESP already points at the next free location in the stack, the decrement happens after placing data on the stack)
After a POP, ESP points to a higher address (address is incremented (by 4 bytes in case of addresses/pointers)). Increments happen after an item is removed from the stack.
When a function/subroutine is entered, a stack frame is created. This frame keeps the parameters of the parent procedure together and is used to pass arguments to the subrouting. The current location of the stack can be accessed via the stack pointer (ESP), the current base of the function is contained in the base pointer (EBP) (or frame pointer).
The CPU’s general purpose registers (Intel, x86) are :
EAX : accumulator : used for performing calculations, and used to store return values from function calls. Basic operations such as add, subtract, compare use this general-purpose register
EBX : base (does not have anything to do with base pointer). It has no general purpose and can be used to store data.
ECX : counter : used for iterations. ECX counts downward.
EDX : data : this is an extension of the EAX register. It allows for more complex calculations (multiply, divide) by allowing extra data to be stored to facilitate those calculations.
ESP : stack pointer
EBP : base pointer
ESI : source index : holds location of input data
EDI : destination index : points to location of where result of data operation is stored
EIP : instruction pointer
Process Memory
When an application is stared in a Win32 environment, a process is created and virtual memory is assigned to. In a 32 bit process, the address ranges from 0x00000000 to 0xFFFFFFFF, where 0x00000000 to 0x7FFFFFFF is assigned to “user-land”, and 0x80000000 to 0xFFFFFFFF is assigned to “kernel land”. Windows uses the flat memory model, which means that the CPU can directly/sequentially/linearly address all of the available memory locations, without having to use a segmentation/paging scheme.
Kernel land memory is only accessible by the OS.
When a process is created, a PEB (Process Execution Block) and TEB (Thread Environment Block) are created.
The PEB contains all user land parameters that are associated with the current process :
location of the main executable
pointer to loader data (can be used to list all dll’s / modules that are/can be loaded into the process)
pointer to information about the heap
The TEB describes the state of a thread, and includes
location of the PEB in memory
location of the stack for the thread it belongs to
pointer to the first entry in the SEH chain (see tutorial 3 and 3b to learn more about what a SEH chain is)
Each thread inside the process has one TEB.
The Win32 process memory map looks like this :
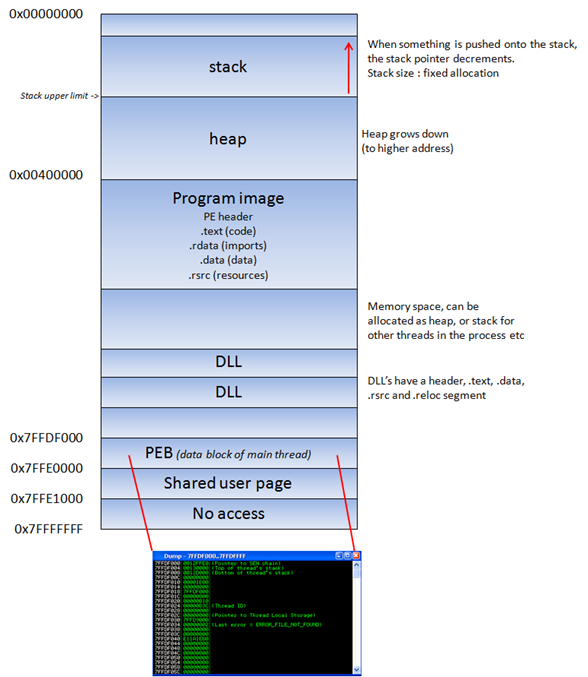
The text segment of a program image / dll is readonly, as it only contains the application code. This prevents people from modifying the application code. This memory segment has a fixed size. The data segment is used to store global and static program variables. The data segment is used for initialized global variables, strings, and other constants.
The data segment is writable and has a fixed size. The heap segment is used for the rest of the program variables. It can grow larger or smaller as desired. All of the memory in the heap is managed by allocator (and deallocator) algorithms. A memory region is reserved by these algo’s. The heap will grow towards a higher addresses.
In a dll, the code, imports (list of functions used by the dll, from another dll or application), and exports (functions it makes available to other dll’s applications) are part of the .text segment.
The Stack
The stack is a piece of the process memory, a data structure that works LIFO (Last in first out). A stack gets allocated by the OS, for each thread (when the thread is created). When the thread ends, the stack is cleared as well. The size of the stack is defined when it gets created and doesn’t change. Combined with LIFO and the fact that it does not require complex management structures/mechanisms to get managed, the stack is pretty fast, but limited in size.
LIFO means that the most recent placed data (result of a PUSH instruction) is the first one that will be removed from the stack again. (by a POP instruction).
When a stack is created, the stack pointer points to the top of the stack ( = the highest address on the stack). As information is pushed onto the stack, this stack pointer decrements (goes to a lower address). So in essence, the stack grows to a lower address.
The stack contains local variables, function calls and other info that does not need to be stored for a larger amount of time. As more data is added to the stack (pushed onto the stack), the stack pointer is decremented and points at a lower address value.
Every time a function is called, the function parameters are pushed onto the stack, as well as the saved values of registers (EBP, EIP). When a function returns, the saved value of EIP is retrieved from the stack and placed back in EIP, so the normal application flow can be resumed.
Let’s use a few lines of simple code to demonstrate the behaviour :
#include
void do_something(char *Buffer)

{

char MyVar[128];

strcpy(MyVar,Buffer);

}
int main (int argc, char **argv)

{

do_something(argv[1]);

}
(You can compile this code. Get yourself a copy of Dev-C++ 4.9.9.2, create a new Win32 console project (use C as language, not C++), paste the code and compile it). On my system, I called the project “stacktest”.
Run the application : “stacktest.exe AAAA”. Nothing should return.
This applications takes an argument (argv[1] and passes the argument to function do_something(). In that function, the argument is copied into a local variable that has a maximum of 128 bytes. So… if the argument is longer than 127 bytes (+ a null byte to terminate the string), the buffer may get overflown.
When function “do_something(param1)” gets called from inside main(), the following things happen :
A new stack frame will be created, on top of the ‘parent’ stack. The stack pointer (ESP) points to the highest address of the newly created stack. This is the “top of the stack”.
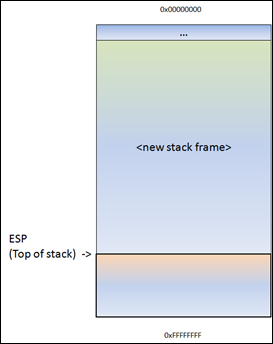
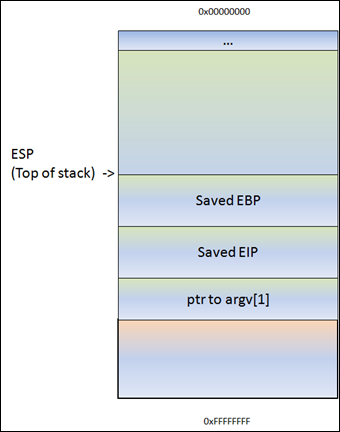
Before do_something() is called, a pointer to the argument(s) gets pushed to the stack. In our case, this is a pointer to argv[1].
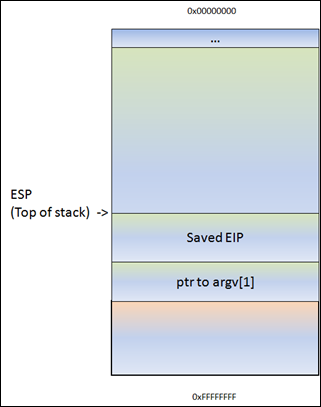
Stack after the MOV instruction :
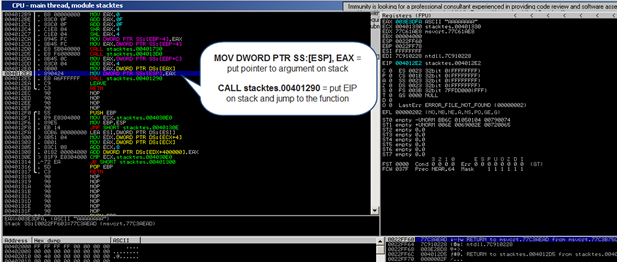
Next, function do_something is called. The CALL instruction will first put the current instruction pointer onto the stack (so it knows where to return to if the function ends) and will then jump to the function code.
Stack after the CALL instruction :
As a result of the push, ESP decrements 4 bytes and now points to a lower address.
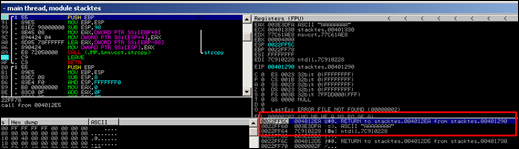
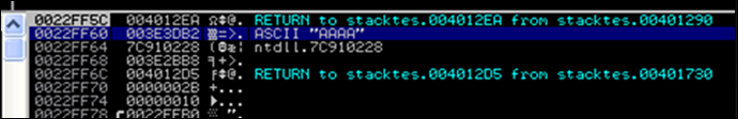
(or, as seen in a debugger) :
ESP points at 0022FF5C. At this address, we see the saved EIP (Return to…), followed by a pointer to the parameter (AAAA in this example). This pointer was saved on the stack before the CALL instruction was executed.
Next, the function prolog executes. This basically saves the frame pointer (EBP) onto the stack, so it can be restored as well when the function returns. The instruction to save the frame pointer is “push ebp”. ESP is decremented again with 4 bytes.
Following the push ebp, the current stack pointer (ESP) is put in EBP. At that point, both ESP and EBP point at the top of the current stack. From that point on, the stack will usually be referenced by ESP (top of the stack at any time) and EBP (the base pointer of the current stack). This way, the application can reference variables by using an offset to EBP.
Most functions start with this sequence : PUSH EBP, followed by MOV EBP,ESP
So, if you would push 4 bytes to the stack, ESP would decrement with 4 bytes and EBP would still stay where it was. You can then reference these 4 bytes using EBP-0x4.
Next, we can see how stack space for the variable MyVar (128bytes) is declared/allocated. In order to hold the data, some space is allocated on the stack to hold data in this variable… ESP is decremented by a number of bytes. This number of bytes wil most likely be more than 128 bytes, because of an allocation routine determined by the compiler. In the case of Dev-C++, this is 0x98 bytes. So you will see a SUB ESP,0x98 instruction. That way, there will be space available for this variable.
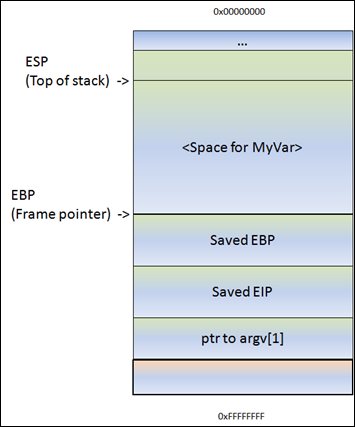
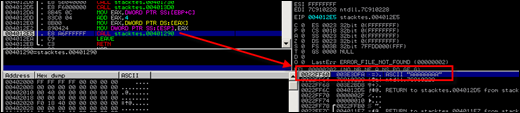
The disassembly of the function looks like this :
00401290  /$ 55             PUSH EBP

00401291  |. 89E5           MOV EBP,ESP

00401293  |. 81EC 98000000  SUB ESP,98

00401299  |. 8B45 08        MOV EAX,DWORD PTR SS:[EBP+8]             ; |

0040129C  |. 894424 04      MOV DWORD PTR SS:[ESP+4],EAX             ; |

004012A0  |. 8D85 78FFFFFF  LEA EAX,DWORD PTR SS:[EBP-88]            ; |

004012A6  |. 890424         MOV DWORD PTR SS:[ESP],EAX               ; |

004012A9  |. E8 72050000    CALL                 ; \strcpy

004012AE  |. C9             LEAVE

004012AF  . C3             RETN
(don’t worry about the code too much. You can clearly see the function prolog (PUSH EBP and MOV EBP,ESP), you can also see where space gets allocated for MyVar (SUB ESP,98), and you can see some MOV and LEA instructions (which basically set up the parameters for the strcpy function… taking the pointer where argv[1] sits and using it to copy data from, into MyVar.
If there would not have been a strcpy() in this function, the function would now end and “unwind” the stack. Basically, it would just move ESP back to the location where saved EIP was, and then issues a RET instruction. A ret, in this case, will pick up the saved EIP pointer from the stack and jump to it. (thus, it will go back to the main function, right after where do_something() was called). The epilog instruction is executed by a LEAVE instruction (which will restore both the framepointer and EIP).
In my example, we have a strcpy() function.
This function will read data, from the address pointed to by [Buffer], and store it in , reading all data until it sees a null byte (string terminator). While it copies the data, ESP stays where it is. The strcpy() does not use PUSH instructions to put data on the stack… it basically reads a byte and writes it to the stack, using an index (for example ESP, ESP+1, ESP+2, etc). So after the copy, ESP still points at the begin of the string.
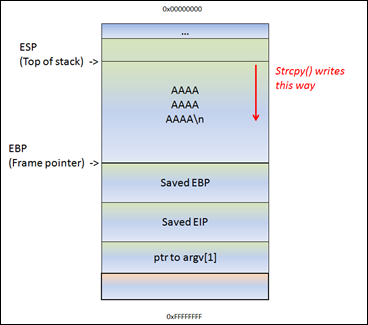
That means… If the data in [Buffer] is somewhat longer than 0x98 bytes, the strcpy() will overwrite saved EBP and eventually saved EIP (and so on). After all, it just continues to read & write until it reaches a null byte in the source location (in case of a string)
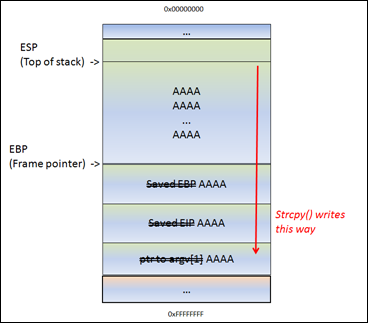
ESP still points at the begin of the string. The strcpy() completes as if nothing is wrong. After the strcpy(), the function ends. And this is where things get interesting. The function epilog kicks in. Basically, it will move ESP back to the location where saved EIP was stored, and it will issue a RET. It will take the pointer (AAAA or 0x41414141 in our case, since it got overwritten), and will jump to that address.
So you control EIP.
Long story short, by controlling EIP, you basically change the return address that the function will uses in order to “resume normal flow”.
Of course, if you change this return address by issuing a buffer overflow, it’s not a “normal flow” anymore.
So… Suppose you can overwrite the buffer in MyVar, EBP, EIP and you have A’s (your own code) in the area before and after saved EIP… think about it. After sending the buffer ([MyVar][EBP][EIP][your code]), ESP will/should point at the beginning of [your code]. So if you can make EIP go to your code, you’re in control.
Note : when a buffer on the stack overflows, the term “stack based overflow” or “stack buffer overflow” is used. When you are trying to write past the end of the stack frame, the term “stack overflow” is used. Don’t mix those two up, as they are entirely different.